Principal Investments required a Drupal website that could be updated daily via an API. This slideshow shows features that were built into their site, principaletfs.com, to access each day's updated funds data (via API) and present the data with insightful patterns for investors to analyze. Click an image to learn more about each screenshot.

Category
Migrated Sites
Financial
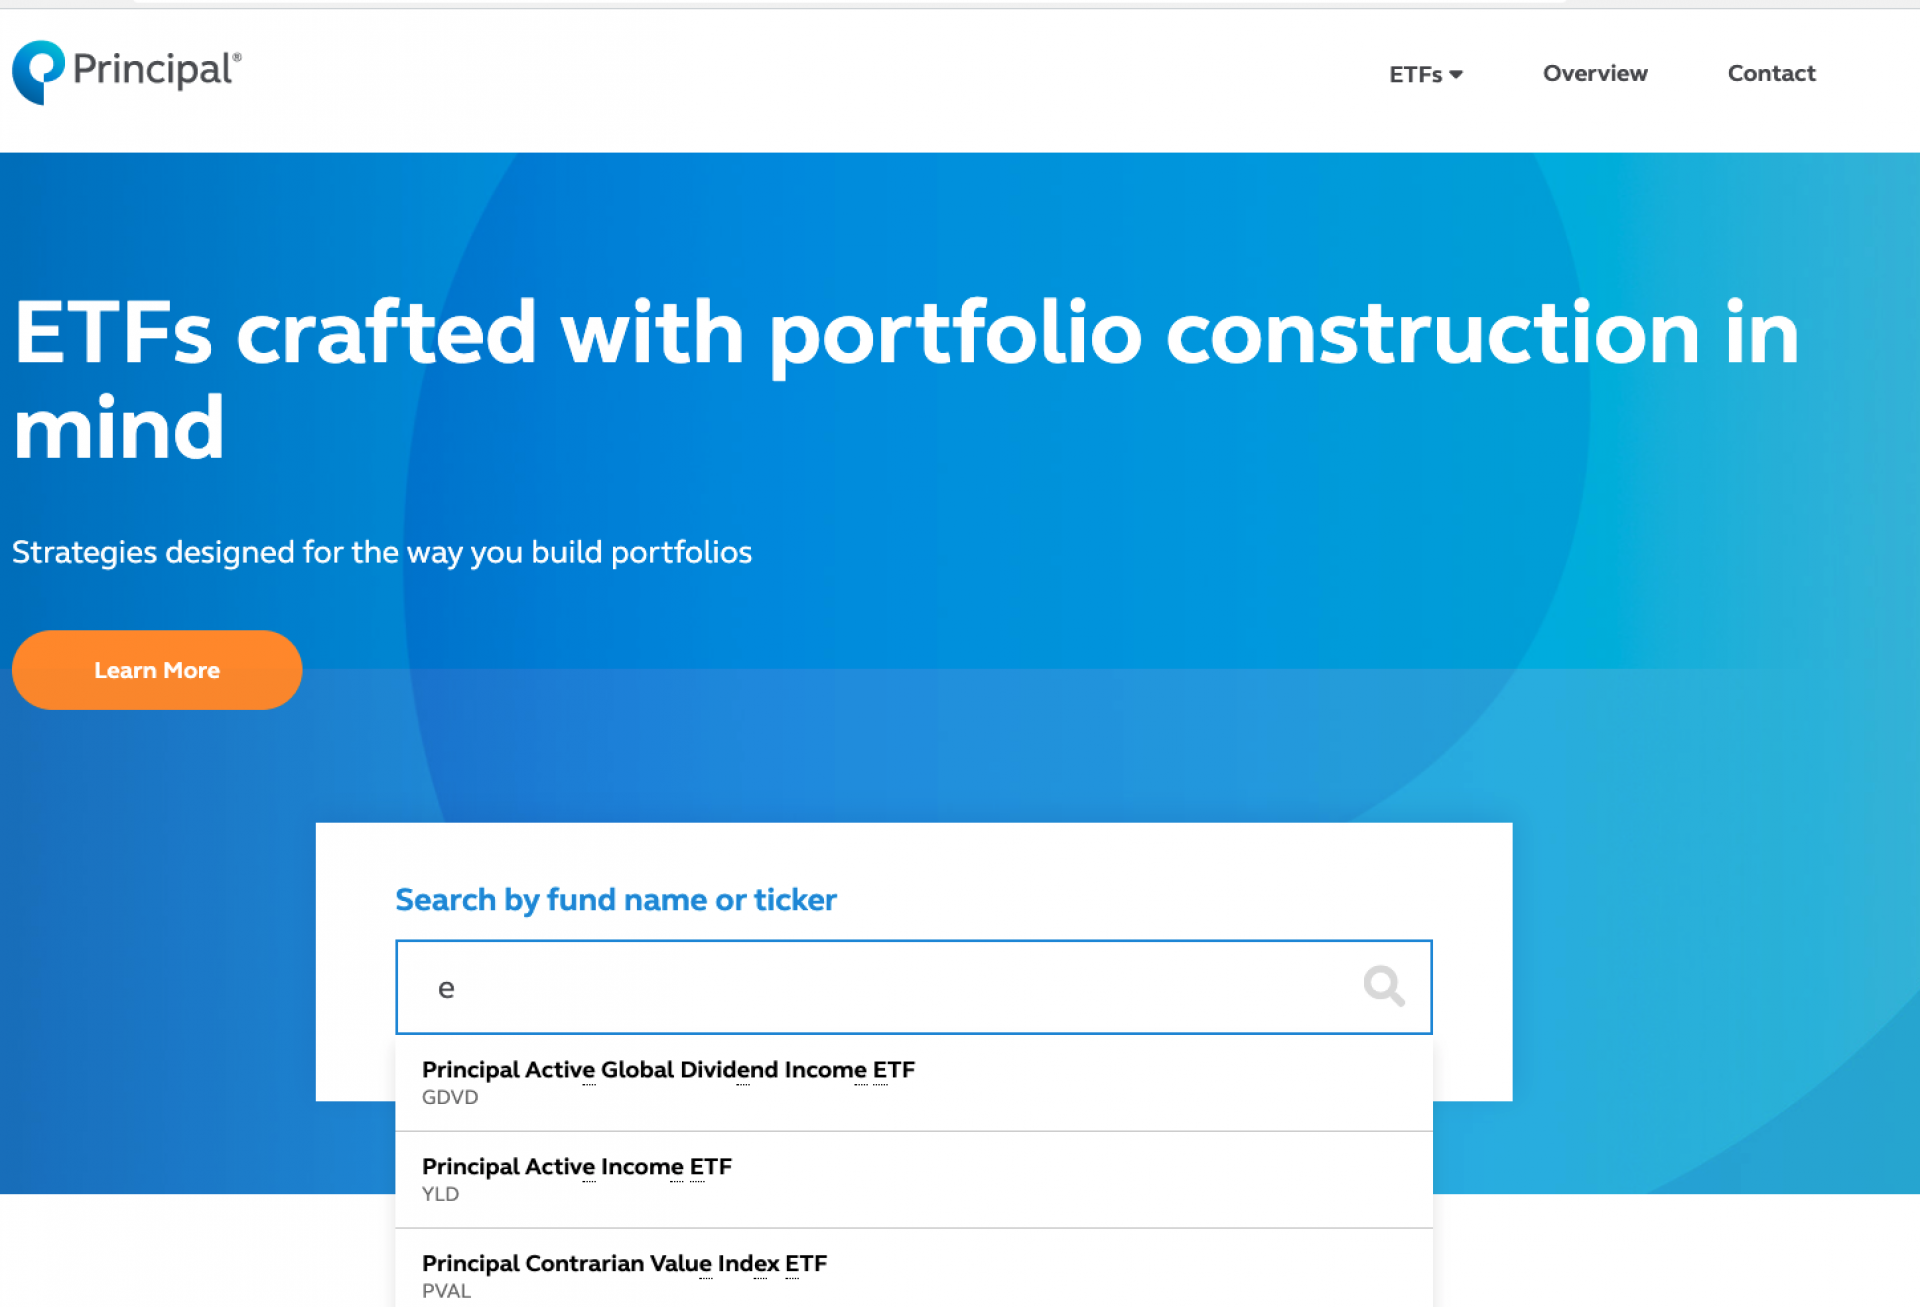
This is a screenshot of Principal ETF's homepage featuring a search box for any ETF fundname (or by ticker). As user types, possible results dropdown and when user completes entry or selects from the dropdown the page quickly redirects to that fund's detail page.
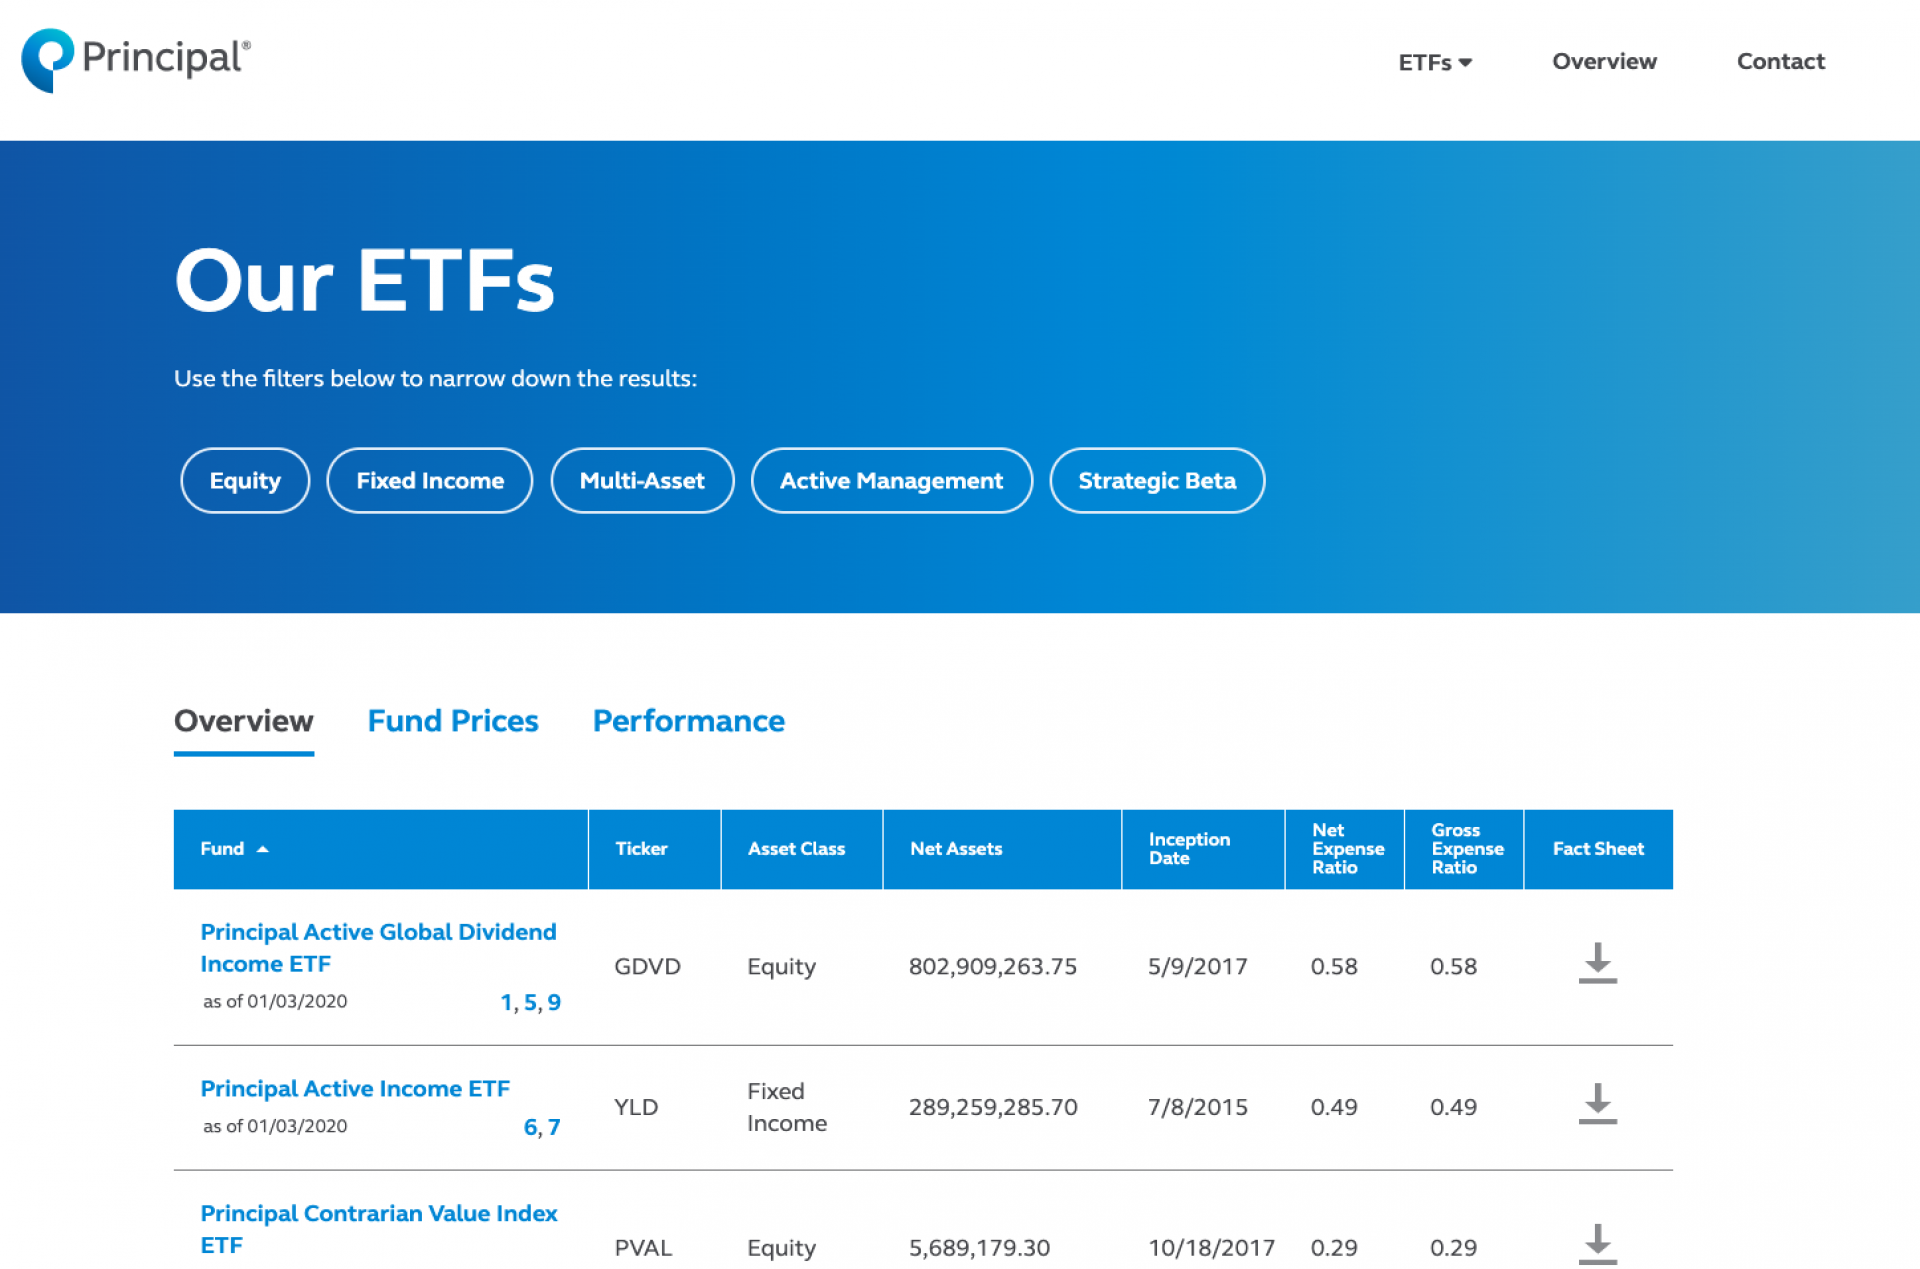
This screenshot displays the ETF overview and statistics of all Principal funds available to invest. It includes filtering by type and 3 displays to analyze.
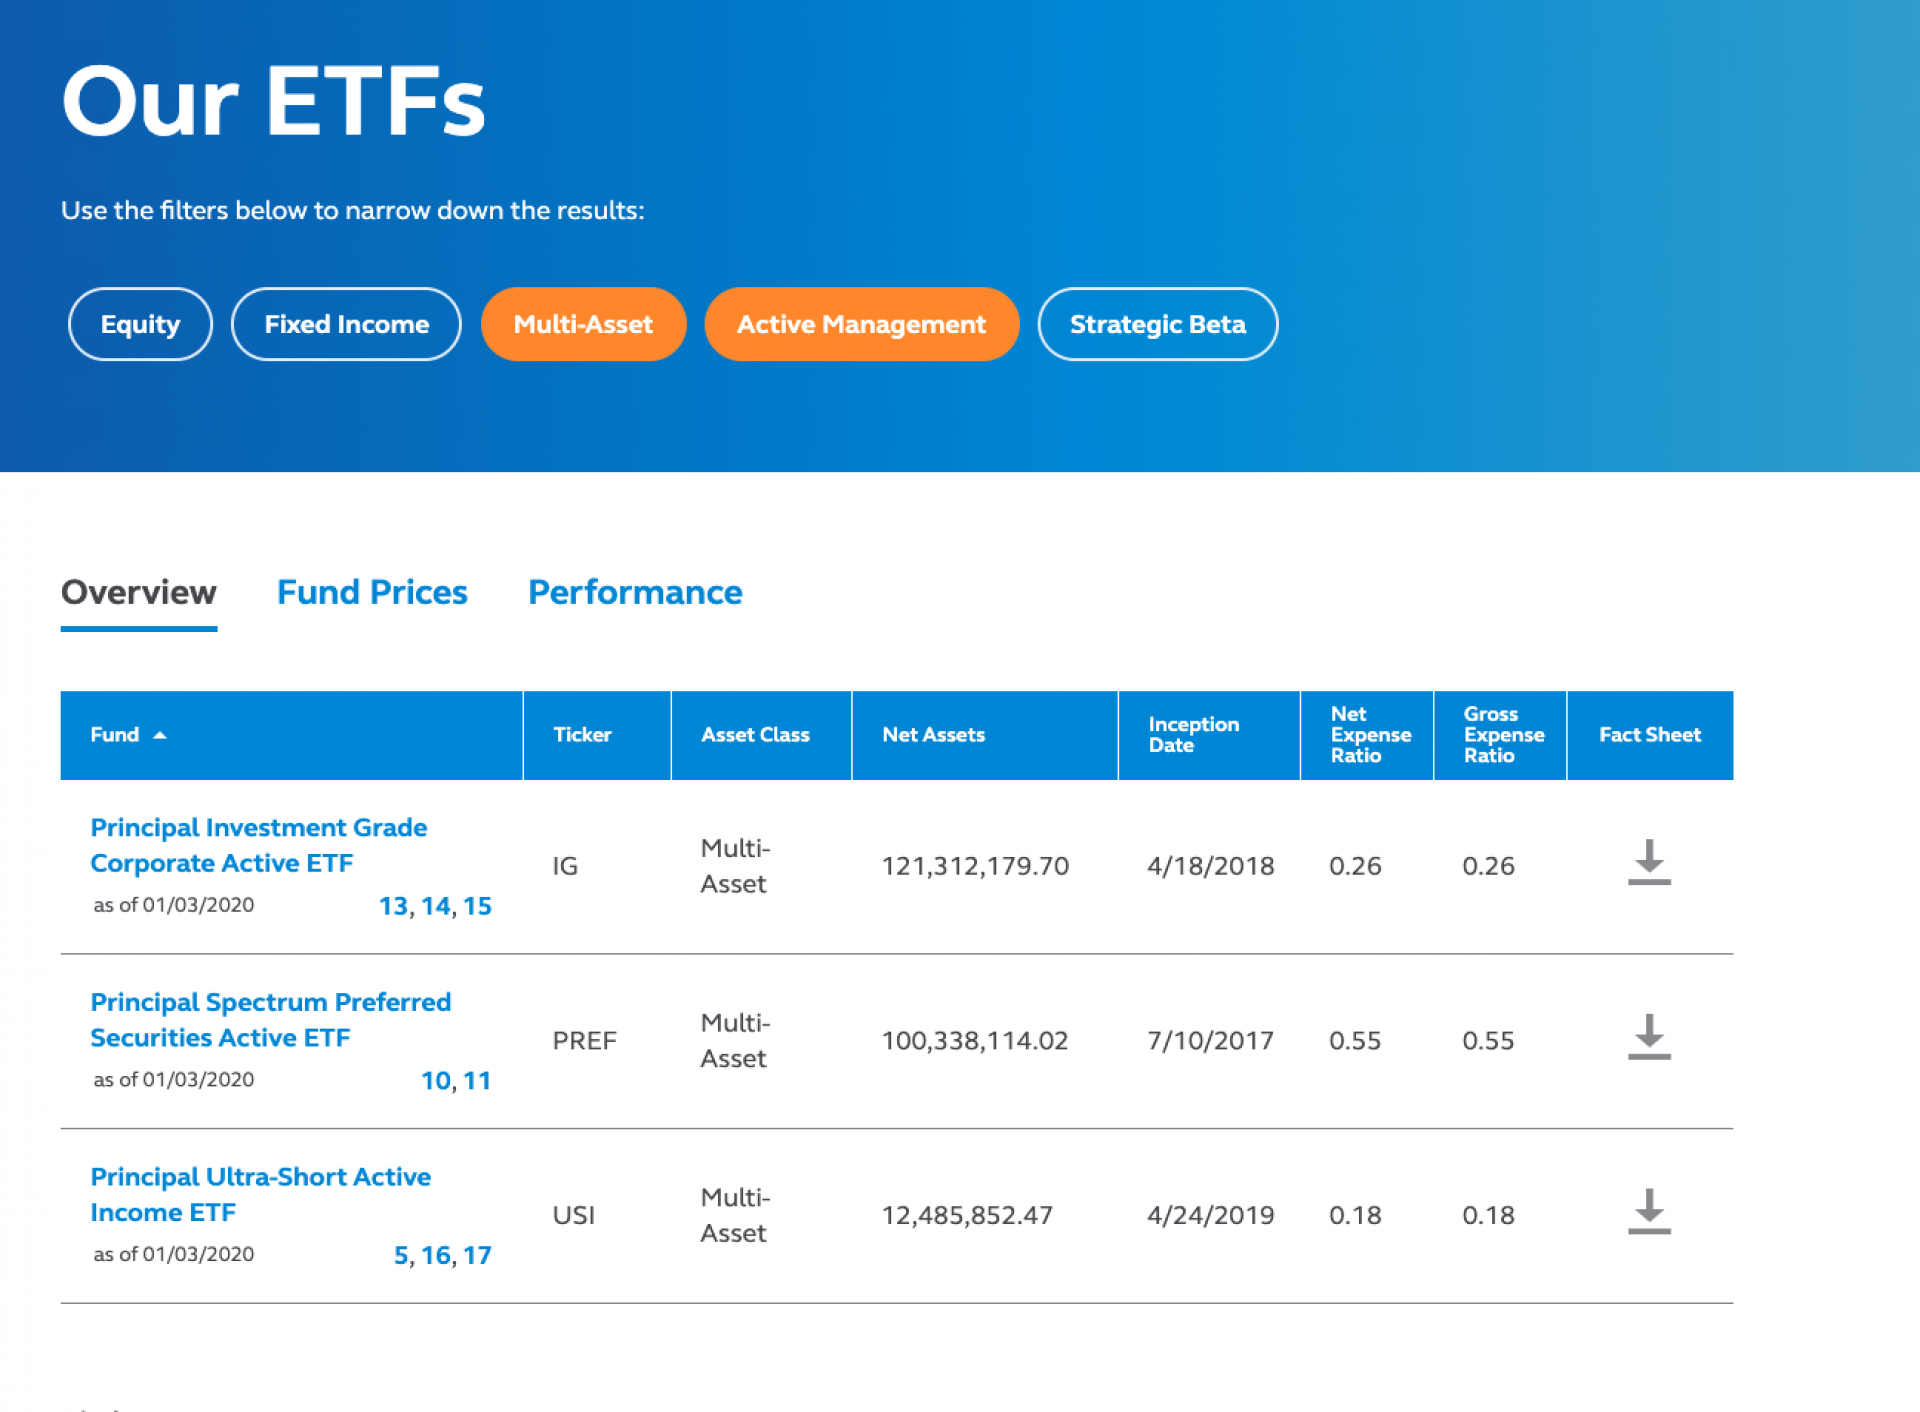
This screenshot shows filtered ETF's by Multi-Asset and Active Management.
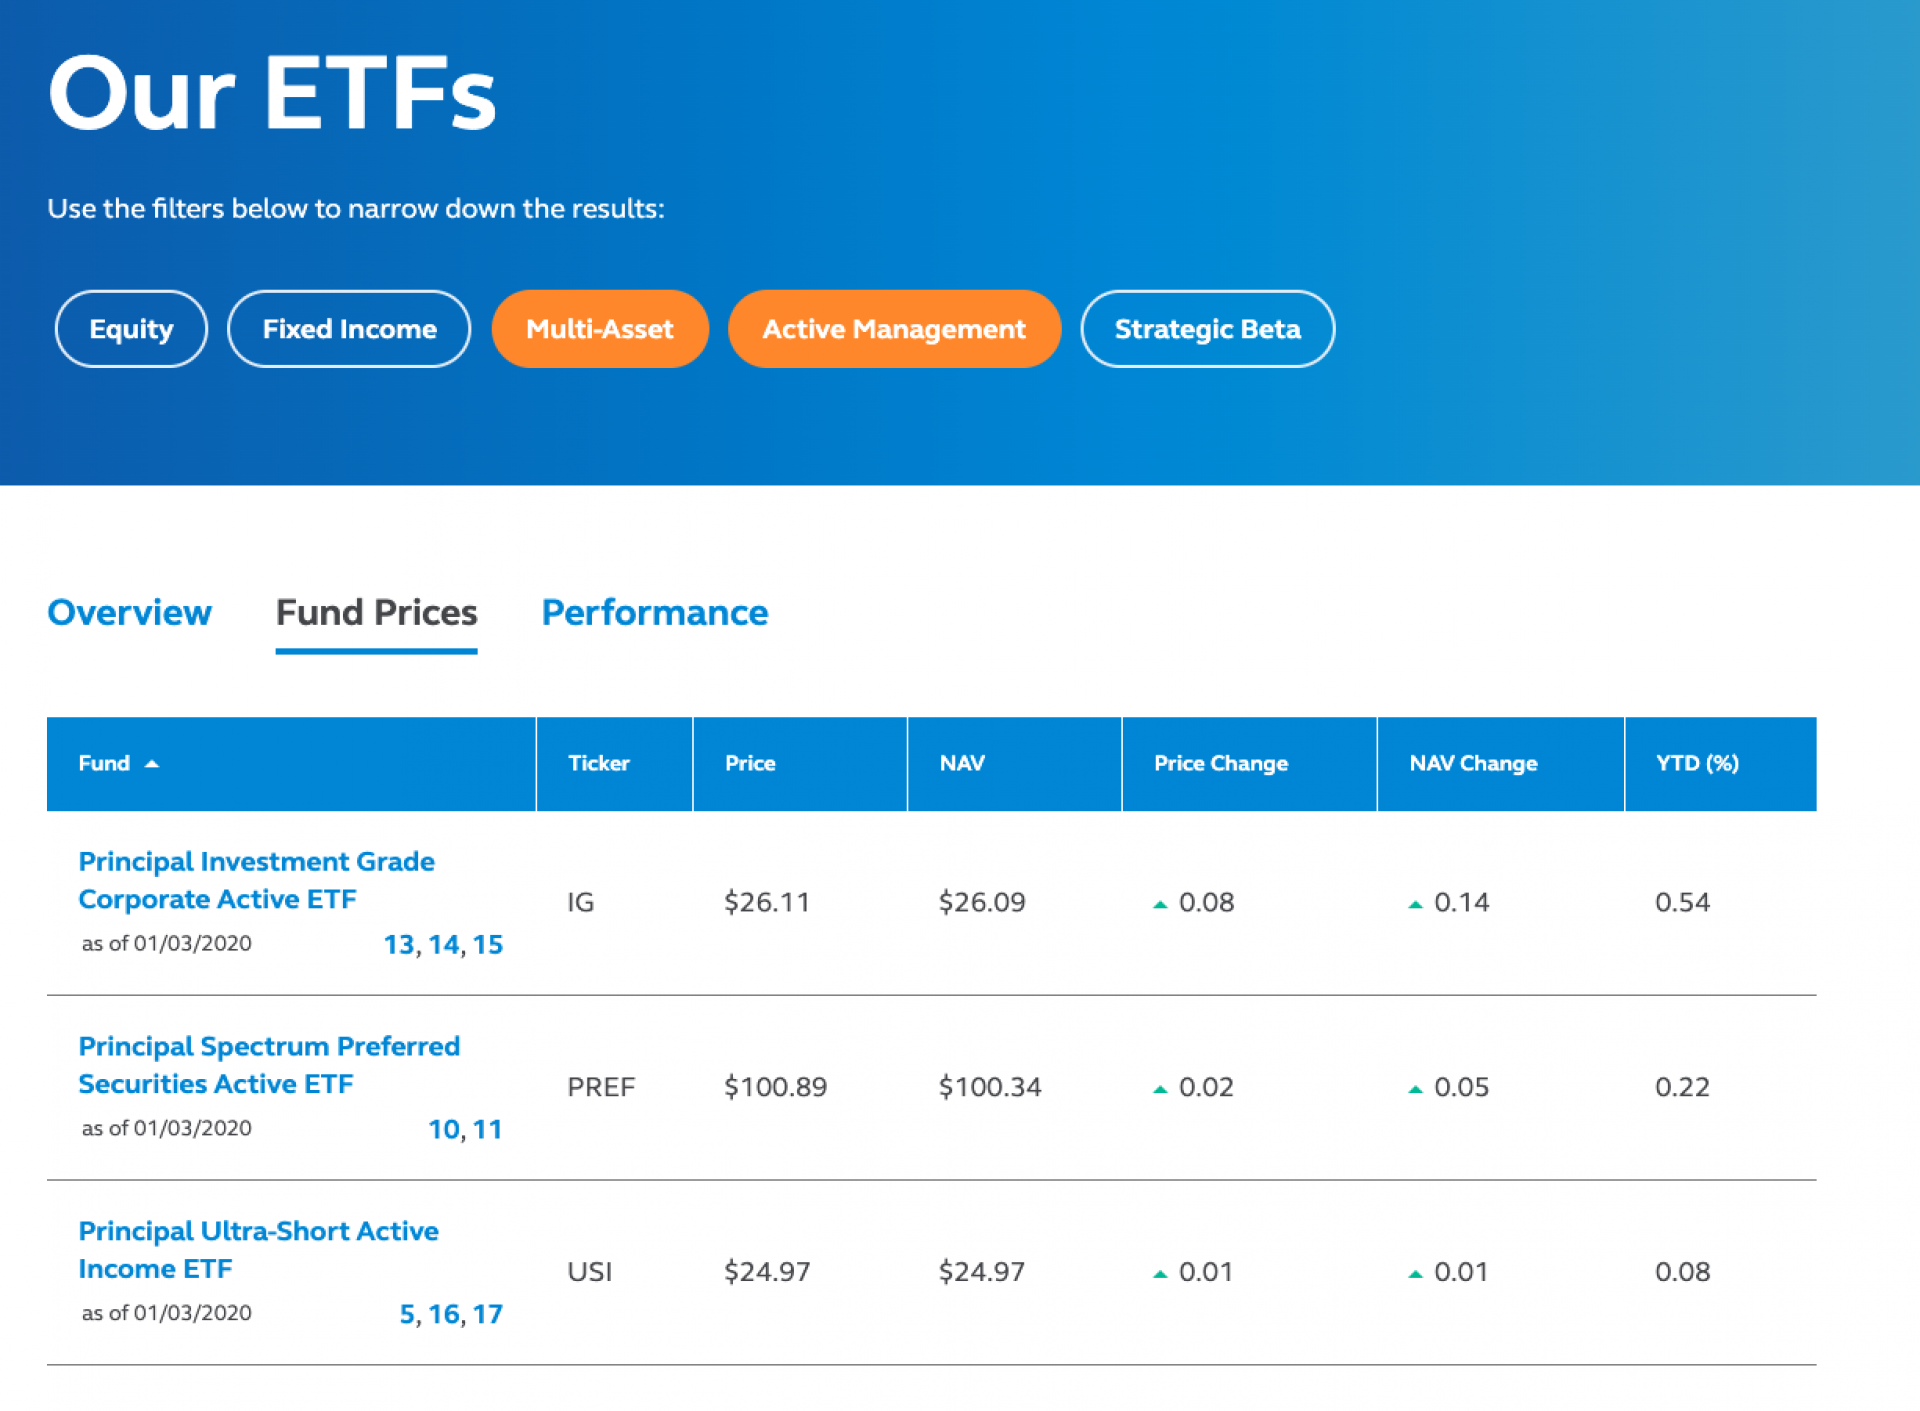
And this screenshot shows the Fund Prices display of data with same filter criteria of previous slide.
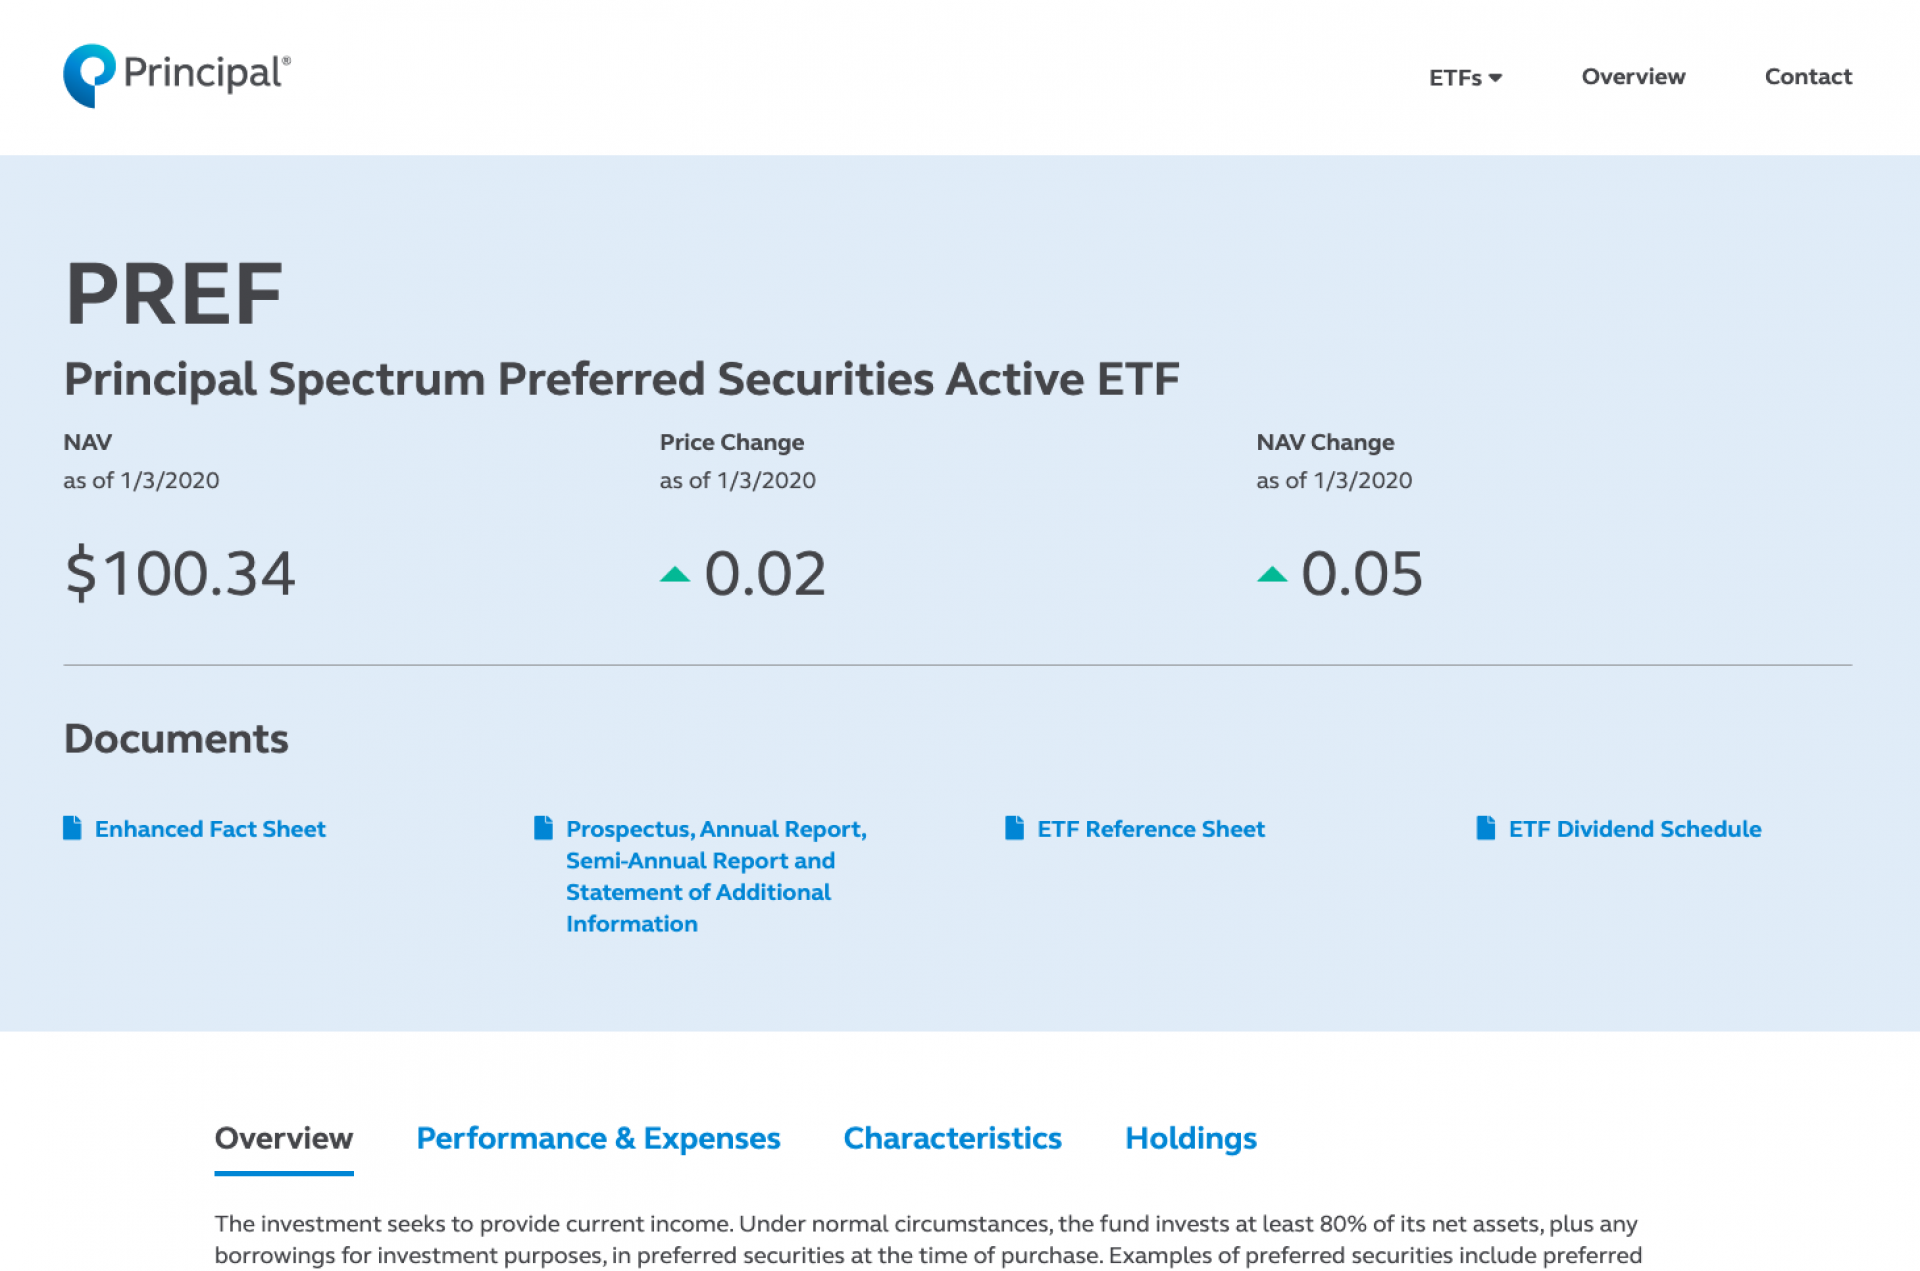
This screenshot is of a Principal fund's detail page. All of this financial data feeds in from a JSON API and is automatically updated daily (via cron jobs). You can see here a top overview of price/NAV/date change, as well as documents that get updated via same JSON API and provided as download links.
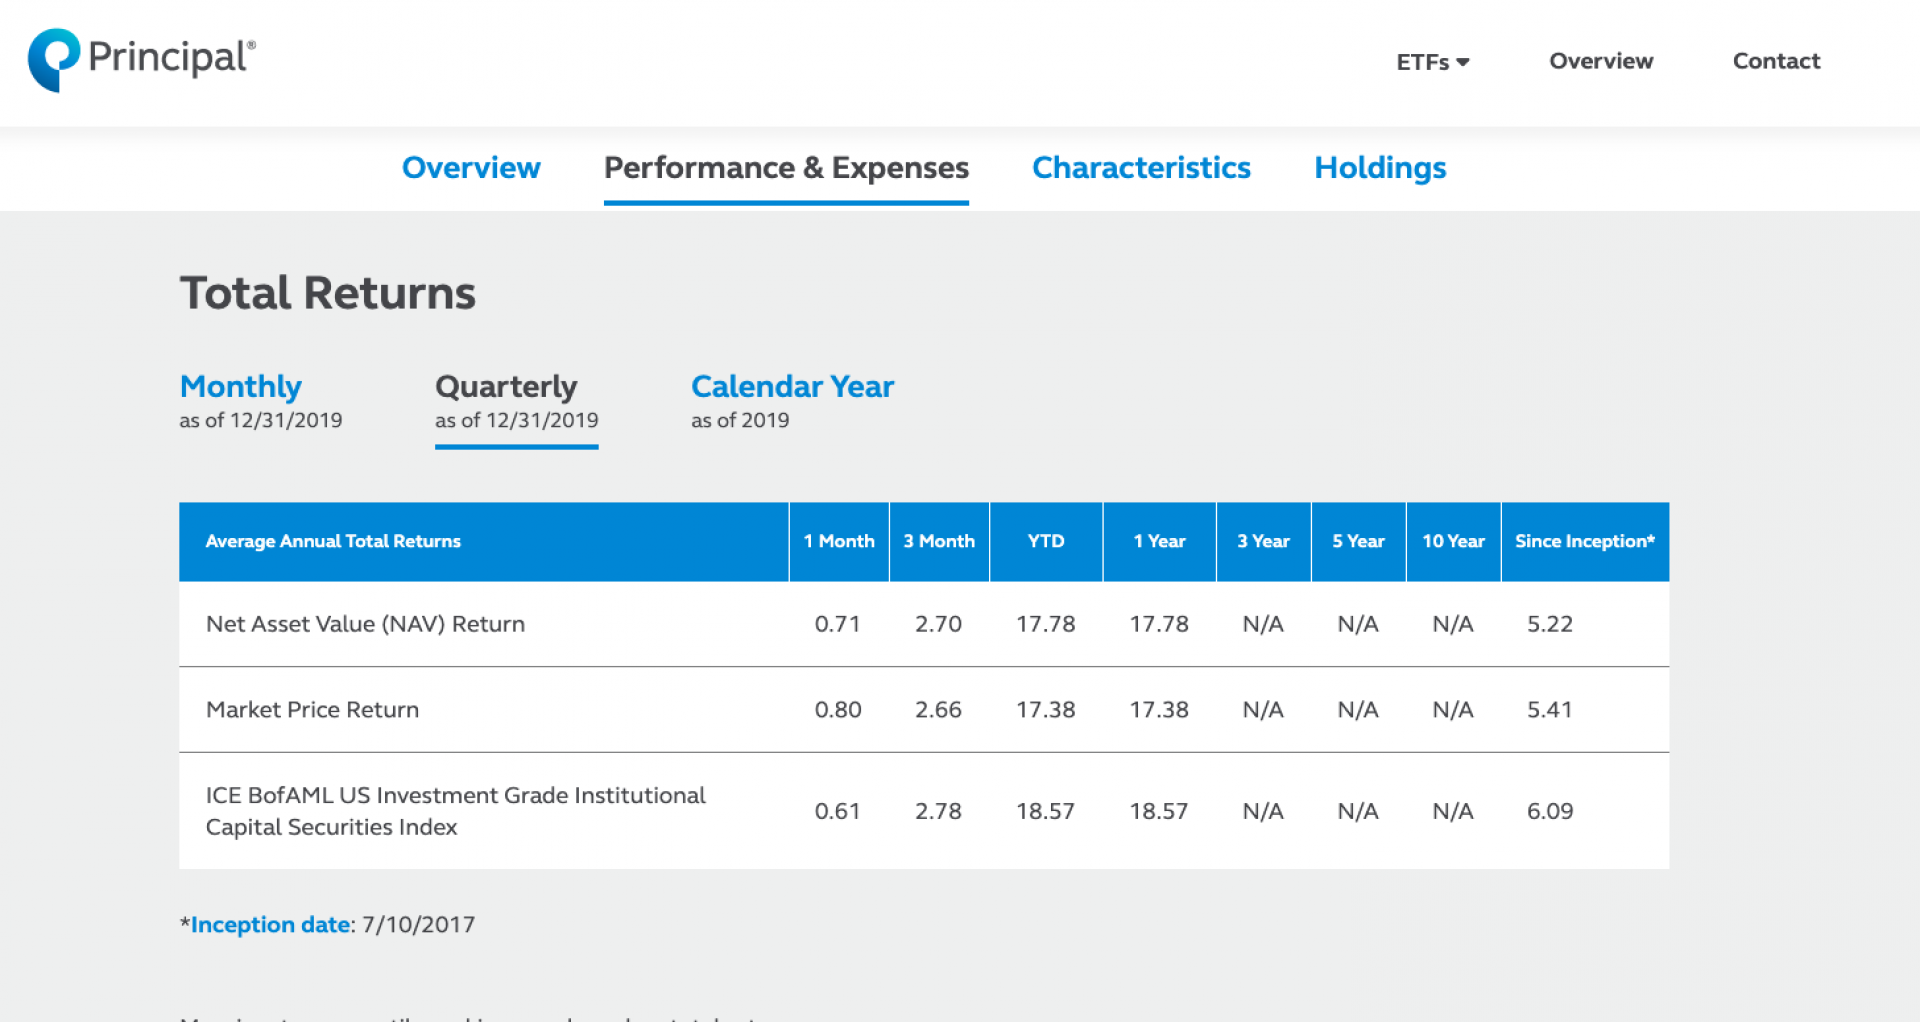
Scrolling down the detail page, in this screenshot, I created and embedded a Drupal view to display Total Returns, providing a Monthly/Quarterly/Calendar Year display.
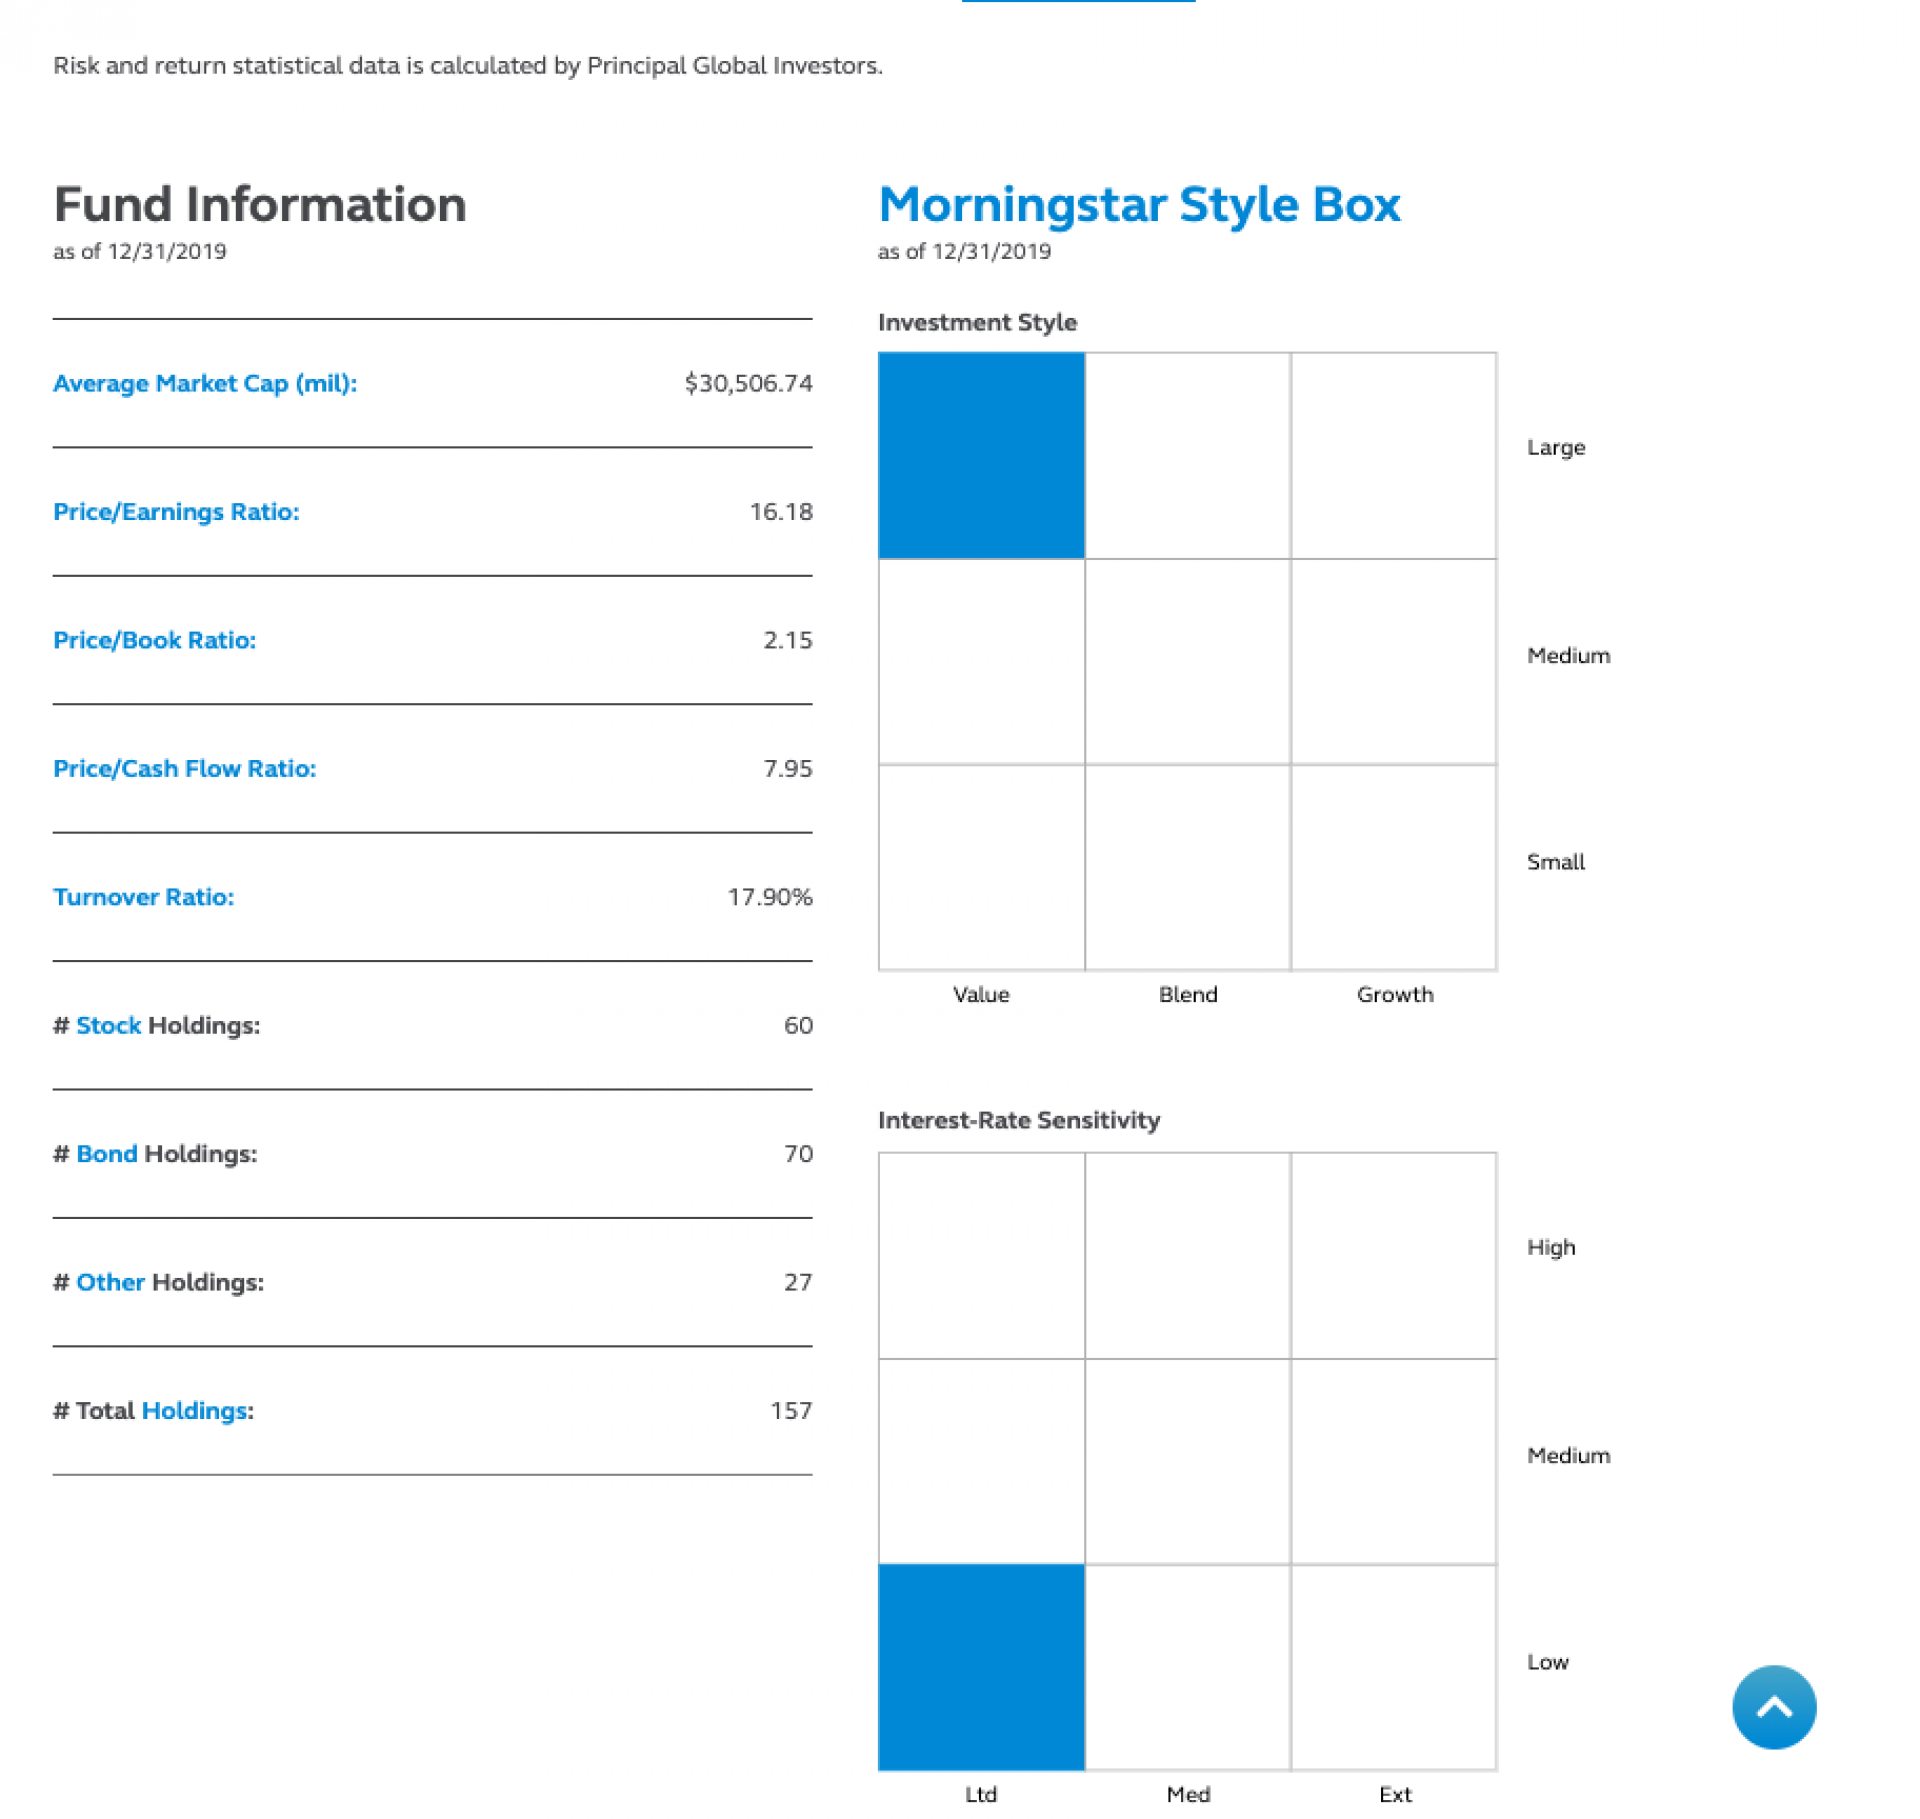
This view is also from the detail page to show chart info. For that I utilized a Javascript library called D3.js to produce these data-driven widgets.
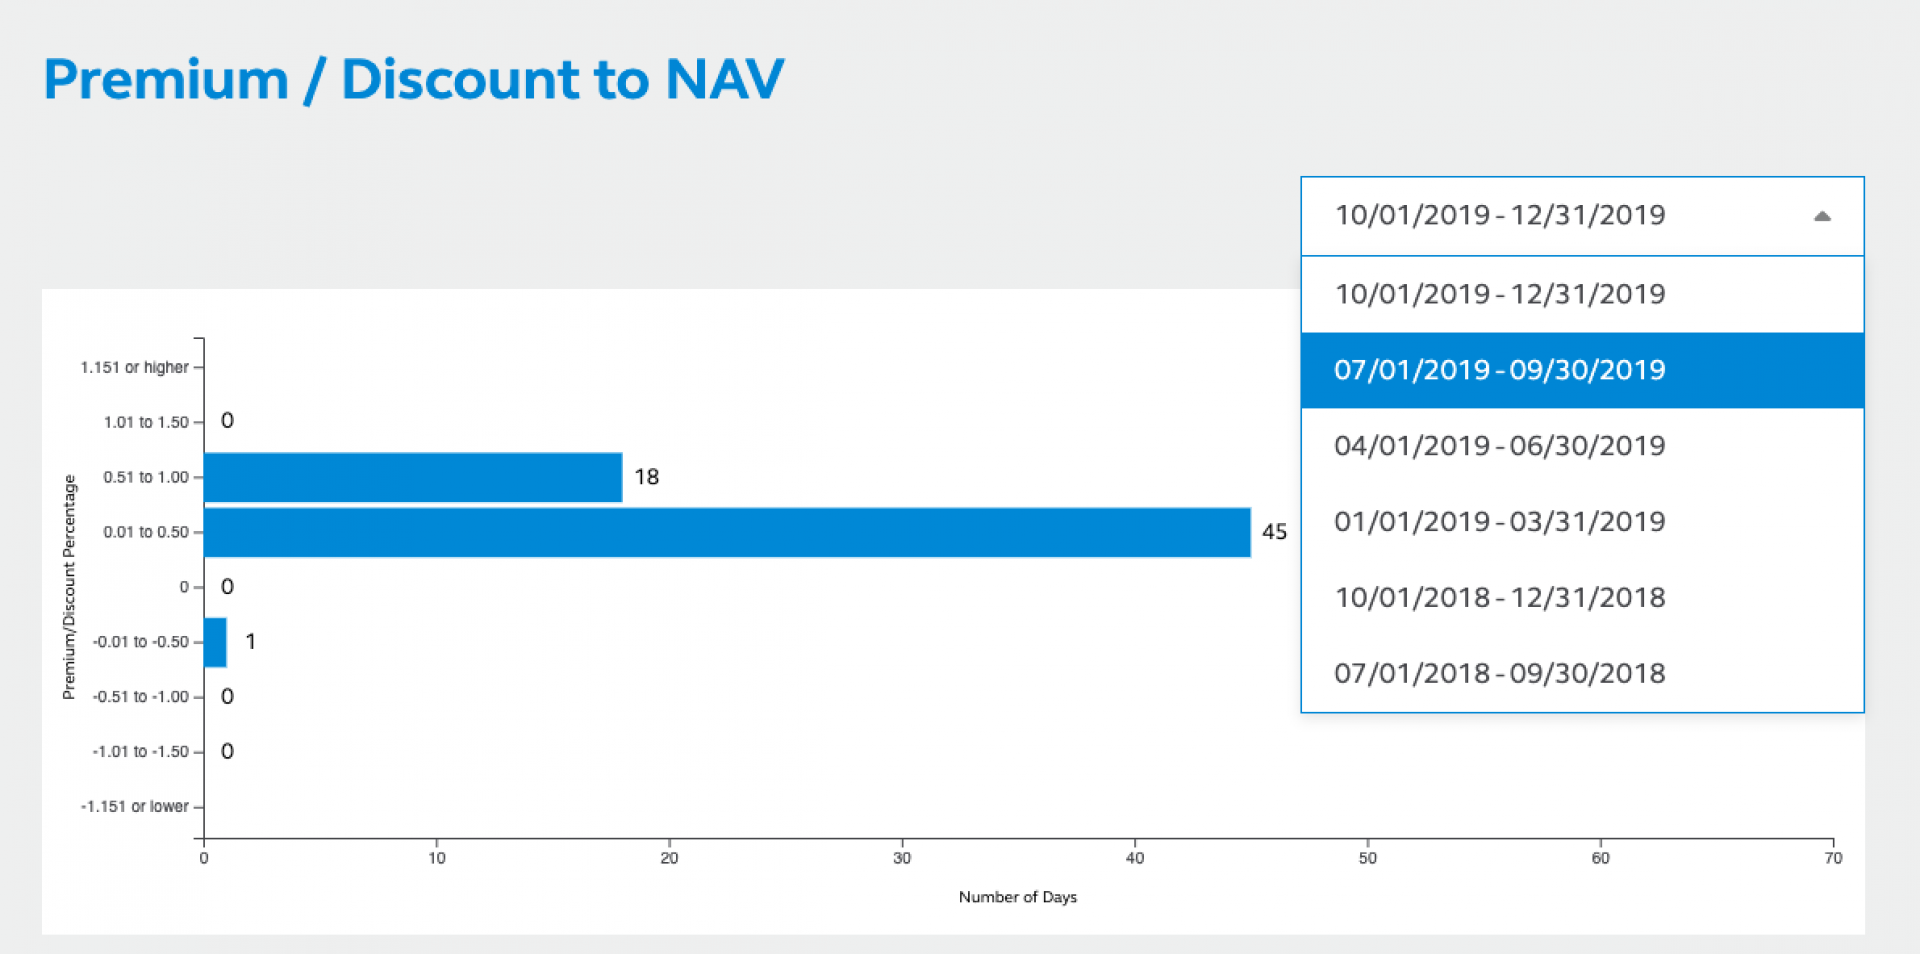
This screenshot again is from the detail page, showing data-driven widget for Premium Nav, sortable by past quarters' performances.